Here are trending economic and food industry data points, as well as major economic and company earnings releases for the coming week: inflation analysis, food commodities outlook, The Kroger Co. (KR) earnings digest, and more.
Why should the food industry pay more attention to PPI than CPI?
The Consumer Price Index (CPI) is the most well-known indicator of inflation and “changes in CPI” and “changes in inflation” are usually synonymous. However, in the current economic environment, the Producer Price Index (PPI) is a far more important indicator of inflation than CPI. Let’s take a look at the underlying reasoning and some key areas that the food industry should watch closely.
How does PPI differ from CPI?
PPI differs from CPI in two critical areas: 1) composition of the basket, and 2) price differences
- Composition of the basket:
- PPI encompasses the entire domestic output, including purchases by producers, retailers, consumers, and everything in between. Imports are excluded.
- CPI only considers consumption of U.S. urban households. It does include imports.
- Price differences:
- Price of an item in PPI reflects revenue received by its producer, net of taxes. It is more correlated with cost of production.
- Price of an item in CPI reflects consumer expenditure, which includes taxes, and, implicitly, margins of all the intermediaries.
Research shows that PPI is a better indicator of inflationary cycles in the new millennium
Historically CPI and PPI were highly correlated, but since 2000, the correlation has fallen substantially. In a recent NBER paper, economists from Columbia University provided a structural explanation of the divergence. Over the past two decades, offshoring, international trades, and technology became more important in the global supply chain. Research suggests that the decline in correlation of the two measures is likely to be permanent in this new world economic regime, and PPI rather than CPI is a better indicator of inflationary cycles. As such, PPI should be the targeting variable in monetary policies.
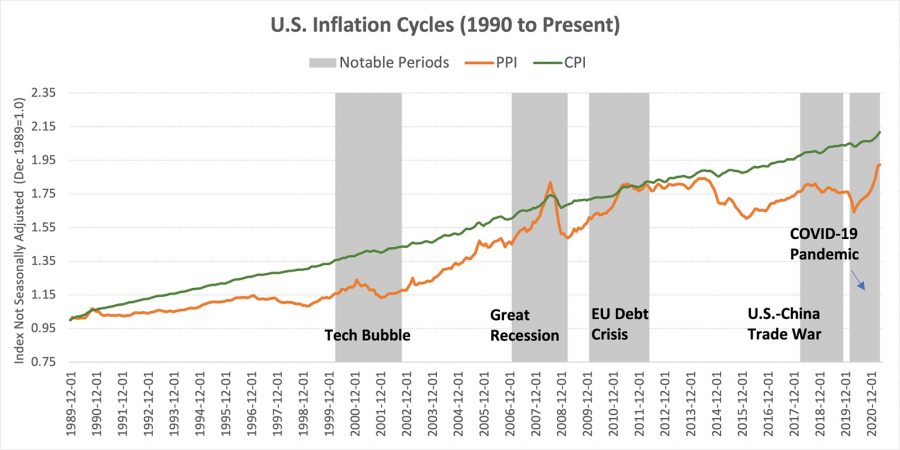
Source: Federal Reserve Economic Data
Key areas of inflation that the food industry should pay close attention to
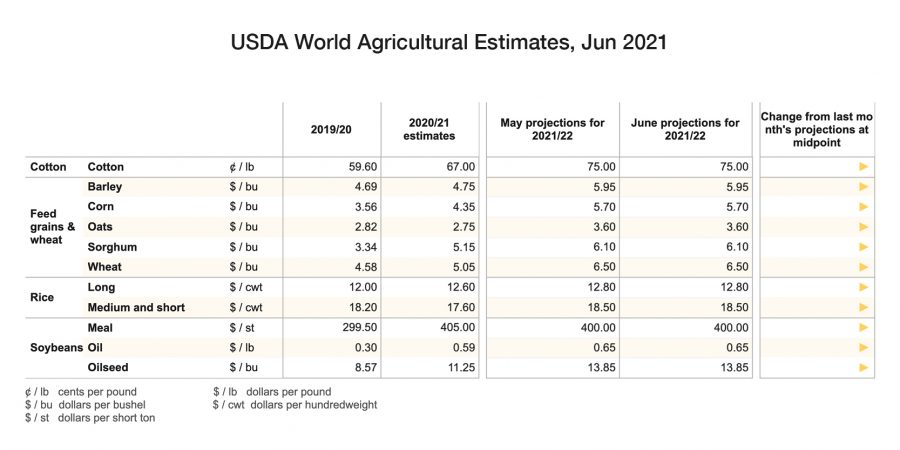
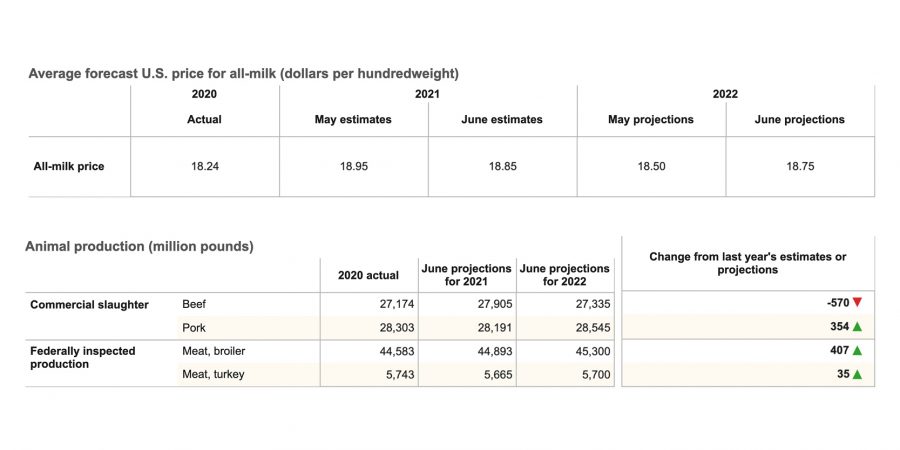
The tables below show the latest PPI datapoints and food price outlook by USDA-WASDE and the Bureau of Labor Statistics. Several commodities are expected to experience significant inflation in 2021: soybeans, wheat, and pork.
| Producer Price Index item | Annual 2019 | Annual 2020 | 20-year historical average | Forecast range2 2021 | |
| % | % | % | % | ||
| Crude foodstuffs and feedstuffs | 0.9 | -4.1 | 2.9 | ||
| Intermediate foods and feeds | 0.5 | 1.8 | 3.1 | ||
| Finished consumer foods | 2.0 | 1.4 | 2.3 | ||
| Farm level cattle | -0.8 | -4.9 | 2.8 | 5.0 to 8.0 (+) | |
| Wholesale beef | 2.0 | 2.4 | 3.6 | 1.5 to 4.5 (+) | |
| Wholesale pork | 4.6 | 2.6 | 1.9 | 8.5 to 11.5 (+) | |
| Wholesale poultry | 1.5 | -0.5 | 1.7 | 13.0 to 16.0 (+) | |
| Farm level eggs | -34.0 | 11.0 | 5.9 | 5.0 to 8.0 (+) | |
| Farm level milk | 15.0 | -4.4 | 3.9 | ||
| Wholesale dairy | 4.7 | 0.3 | 2.4 | 0.0 to 3.0 (-) | |
| Farm level soybeans | -5.5 | 10.2 | 4.9 | 48.5 to 51.5 (+) | |
| Wholesale fats and oils | -4.3 | 2.4 | 5.1 | 16.5 to 19.5 (+) | |
| Farm level fruit | -6.1 | 2.0 | 2.4 | 2.0 to 2.5 (+) | |
| Farm level vegetables | 13.0 | 3.5 | 3.8 | 6.0 to 9.0 (+) | |
| Farm level wheat | -8.0 | 7.5 | 5.0 | 8.5 to 11.5 (+) | |
| Wholesale wheat flour | -2.2 | 1.1 | 4.0 | 4.5 to 7.5 (+) |
- Source: U.S. Bureau of Labor Statistics PPI (not seasonally adjusted) and forecasts by USDA..
- A negative sign indicates an adjustment downward and a plus sign indicates an adjustment upward.
Domestic and international demand for soybeans remains high as the global economy recovers. China, the world’s biggest buyer of soybeans, more than tripled its import of U.S. soybeans this year. The rise of plant-based foods increased domestic consumption. USDA predicts farm-level soybean prices to increase 48.5% to 51.5% in 2021. The rising price of soybeans should also lead to price increases for wholesale fats and oils, which are expected to rise 16.5% to 19.5%.
Pork exports are expected to increase ~20% relative to pre-pandemic levels. USDA data showed strong shipments to Mexico, Canada, as well as to Central and South America. Wholesale pork prices are predicted to increase 8.5% to 11.5%.
Tight stocks and lower-than-expected production levels are expected to boost wheat prices throughout 2021. Farm-level wheat prices are now predicted to rise 8.5% to 11.5%, and wholesale wheat flour prices are projected 4.5% to 7.5% higher.
Upcoming Economic Releases
| Forecast | Previous | |||
| 6/23/2021 | Markit manufacturing PMI (Jun) | 62.1 | 60.5 | |
| 6/23/2021 | Markit services PMI (Jun) | 70.4 | 64.7 | |
| 6/24/2021 | Continuing jobless claims (weekly) | 3.5 mil | 3.52 mil | |
| 6/24/2021 | GDP Growth Rate | 6.4% | 4.3% | |
| 6/25/2021 | Personal income (May) | -2.8% | -13.1% |
Source: Bloomberg, CNBC, Trading Economics, Food Institute
For more information on CPI/PPI and Retail Sales, go to Food Institute Economic Benchmarking.
Select Food & Beverage Industry Data Points
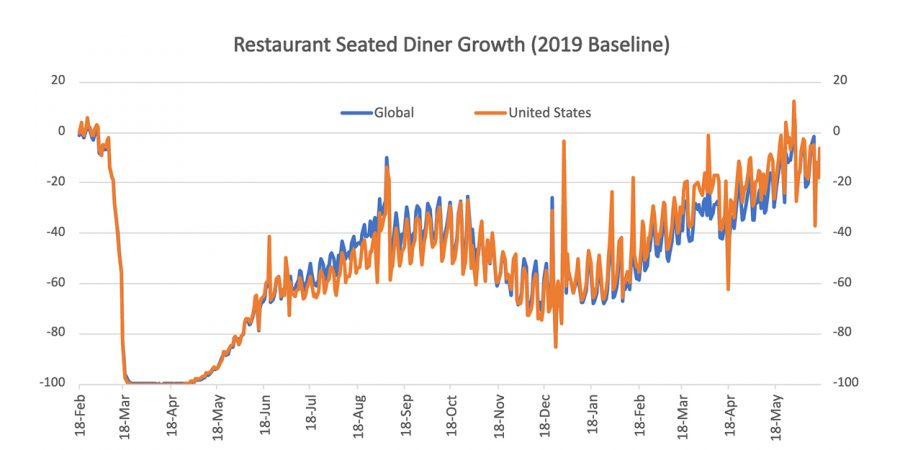
Foodservice – Restaurants
OpenTable restaurant diner growth data (2019 baseline): U.S. = -6% as of June 16, 2021
Food Retail
The Kroger Co. (KR) reported Q1 2021 results
- Sales: $41.3 billion vs. $41.5 billion last year
- Ex-fuel, sales decreased 4%
- Gross Margin: 22.6% (FIFO gross margin decreased by 65 bps)
- Operating Profit: $805 million vs. $1,326 million last year
- Digital Sales: rose +16% vs. +92% last year
- Media revenue rose +33% per digital basket
Key Takeaways:
- 2021 Raised Guidance: +10.1% to +11.6% (i.e., 2yr identical sales stack with 2019 base year)
- Management announced a new $1 billion share repurchase program
- Inflation risks were downplayed during the earnings call, as Management views the inflation fears as transitory
- Alternative Profit on track to grow by $100 million to $150 million

Earnings Calendar of Select Companies
| Announce Date | Company | EPS Estimate | Previous Quarter EPS | |
| 6/24/2021 | Darden Restaurants, Inc. (DRI) | $ 1.76 | $ 0.98 |
Source: Bloomberg, CNBC, Yahoo Finance, Food Institute