Here are trending economic and food industry data points, as well as major economic and company earnings releases for the coming week: inflation analysis, earnings from Campbell Soup Company (CPB), Chewy, Inc. (CHWY), and more.
Is inflation transitory, cyclical, or secular?
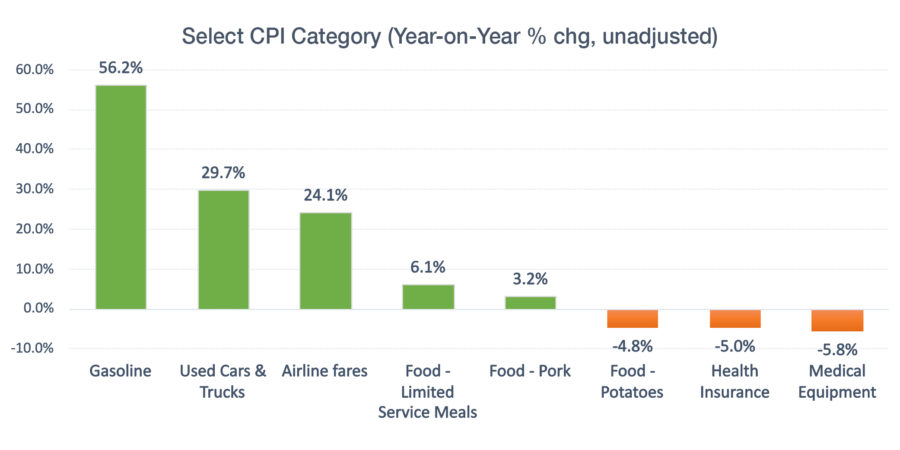
Almost all prices are going up! The latest Consumer Price Index (CPI) increased 0.6% in May, and 5.0% over the last 12 months, the biggest 12-month increase since August 2008. The current controversy is whether or not this jump is transitory. Let’s dive into some of the biggest drivers.
It’s going to be a lot more expensive to hit the road
Used cars prices were up 29.7% over the last 12 months. Usually car prices depreciate over time, but COVID fears compelled commuters to avoid public transit and drive themselves. As businesses plan to bring more employees back on-site, this trend may not fade away so quickly.
Gasoline prices were up 56.2% year-over-year (YoY). During the pandemic lockdown, OPEC decided to cut oil production by 9.7 million barrels a day. As economies re-opened, OPEC+ countries gradually increased production, yet they are hesitant to bring production back to full capacity. The bad news for summer travelers is that prices at the pump will likely go up in the foreseeable future. Over the long term, however, a shift towards electric vehicles will decrease overall reliance on fossil fuels and demand for gasoline.
Airfares were up 24.1% YoY. With higher energy prices, additional costs for health and safety, and limited business travel, airlines are facing challenges on multiple fronts, just as vacation demand starts to lift off. Even when everyone is vaccinated, the cost of travel may never be the same again.
Source: bls.gov
Fast food may not be the cheapest option
Food prices were up 2.2% YoY. Relative to other categories, the gain seems moderate. Across various food sub-categories, there are two areas that have gained some attention: limited-service meals and meat prices.
The limited-service meals index rose 6.1% YoY. Restaurants have been one of the most battered industries during the pandemic. Just as restrictions ease, restaurants are faced with new challenges: higher transportation costs, labor shortages, and potentially higher wage costs. Many customers saw higher delivery costs being added to their tabs. In the post-pandemic world, service fees will likely increase to offset higher operation costs.
Meat prices, particularly pork, are causing some sticker shock. Global economic recovery, particularly in China, is driving up demand for U.S. pork. This trend may prove to be transitory. Recently, China moved to tame its inflation and reduce pork imports.
As the same time, many food sub-categories haven’t changed much over the past year, and a few have dropped. Potato prices fell 4.8% YoY. Food-at-home is forecasted to only increase between 1.5% and 2.5% in 2021 (see table).
Where can you save money?
It seems ironic that during a year of pandemic, prices for health insurance policies are getting cheaper. Multiple fiscal stimulus bills have made COVID-19 testing and vaccination free for all Americans. Furthermore, under the American Rescue Plan, private health insurance through public exchanges is set to become more affordable, at least for a few years.
| Annual 2019 | Annual 2020 | YTD 2021 (Unadjusted) | 20-year historical average | Forecast range2 2021 | |
| % | % | % | % | % | |
| All food | 1.9 | 3.4 | 2.2 | 2.4 | 2.0 to 3.0 |
| Food away from home | 3.1 | 3.4 | 4.0 | 2.8 | 2.5 to 3.5 |
| Food at home | 0.9 | 3.5 | 0.7 | 2.0 | 1.5 to 2.5 (+) |
| Meats, poultry, and fish | 1.0 | 6.3 | 0.4 | 2.9 | 1.5 to 2.5 (+) |
| Meats | 1.3 | 7.4 | -0.1 | 3.2 | 1.5 to 2.5 (+) |
| Beef and veal | 1.6 | 9.6 | -2.6 | 4.4 | 1.0 to 2.0 (+) |
| Pork | 1.2 | 6.3 | 3.2 | 2.2 | 2.0 to 3.0 (+) |
| Other meats | 0.9 | 4.4 | 1.1 | 2.2 | 1.0 to 2.0 (+) |
| Poultry | -0.3 | 5.6 | 0.4 | 2.1 | 0.5 to 1.5 (+) |
| Fish and seafood | 1.6 | 3.3 | 1.9 | 2.5 | 1.5 to 2.5 |
| Eggs | -10.0 | 4.3 | -3.5 | 3.1 | 0.0 to 1.0 (+) |
| Dairy products | 1.0 | 4.4 | 0.1 | 1.8 | 0.5 to 1.5 (+) |
| Fats and oils | -0.7 | 1.3 | 2.6 | 2.2 | 2.0 to 3.0 (+) |
| Fruits and vegetables | 1.0 | 1.4 | 2.9 | 2.0 | 2.0 to 3.0 (+) |
| Fresh fruits and vegetables | 1.0 | 0.8 | 3.2 | 1.9 | 2.0 to 3.0 (+) |
| Fresh fruits | -1.4 | -0.8 | 5.9 | 1.4 | 3.5 to 4.5 (+) |
| Fresh vegetables | 3.8 | 2.6 | 0.4 | 2.5 | 0.0 to 1.0 |
| Processed fruits and vegetables | 1.1 | 3.5 | 1.8 | 2.1 | 1.5 to 2.5 |
| Sugar and sweets | 2.0 | 3.3 | 2.1 | 1.9 | 1.5 to 2.5 |
| Cereals and bakery products | 1.4 | 2.2 | 0.6 | 2.1 | 1.0 to 2.0 (-) |
| Nonalcoholic beverages | 1.9 | 3.6 | -0.2 | 1.3 | 2.0 to 3.0 (-) |
| Other foods | 0.3 | 3.1 | -0.3 | 1.5 | 1.5 to 2.5 (-) |
- Bureau of Labor Statistics estimates. Food prices represent 14.1 percent of the total CPI. Note: Percentages do not add to 100, due to rounding.
- A negative sign indicates an adjustment downward and a plus sign indicates an adjustment upward.
- Source: U.S. Bureau of Labor Statistics Consumer Price Indexes (not seasonally adjusted) and forecasts by USDA, Economic Research Service.
Looking ahead
Some elements of the current inflationary experience may be transitory, some may be cyclical, while others may be secular. While the overall level may not cause any stir at the Federal Reserve, some industries are clearly more affected than others. Many economists have revised their 2021 CPI inflation forecasts from below 2% to 2.5% to currently north of 3%.
Upcoming Economic Releases
| Forecast | Previous | |||
| 6/15/2021 | Retail sales (May) | -0.4% | 0.0% | |
| 6/15/2021 | Producer price index (May) | 0.5% | 0.6% | |
| 6/16/2021 | Import price index (May) | 0.6% | 0.7% | |
| 6/16/2021 | FOMC announcement |
Source: Bloomberg, CNBC, Trading Economics, Food Institute
For more information on CPI/PPI and Retail Sales, go to Food Institute Economic Benchmarking.
Select Food & Beverage Industry Data Points
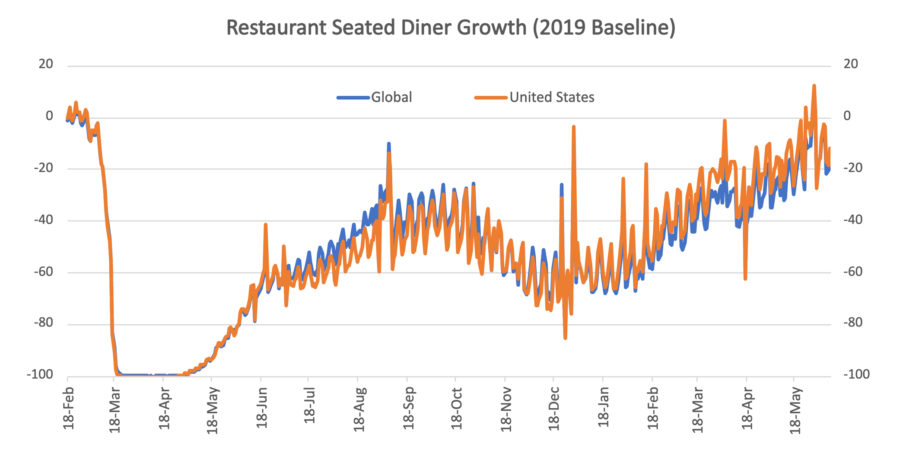
Foodservice – Restaurants
OpenTable restaurant diner growth data (2019 baseline): U.S. = -12% as of June 9, 2021
Food Manufacturing
Campbell Soup Company (CPB) reported Q3 2021 results
- Net Sales: $1.98 billion (-11% Y/Y)
- Segment Results (Net Sales):
- Meals & Beverages: $1,039 million (-14% Y/Y)
- Snacks: $945 million (-8% Y/Y)
- Gross Margin: 31.7% (vs. 34.5% last year)
- EBIT: $283 million (-27%)
- Segment Results (Net Sales):
- Meals & Beverages: $1,039 million (-14% Y/Y)
- Snacks: $945 million (-8% Y/Y)
Key Takeaways:
- 2021 Guidance: -3.5% to -3.0% vs. last year
- The company remains in brands and categories that will likely experience some headwinds as COVID restrictions ease
- Inflation and supply chain constraints remain a concern in Q4
- Innovation around meal solutions may be a positive over the medium term
Chewy, Inc. (CHWY) reported Q1 2021 results
- Net Sales: $2.14 billion (+31.7% Y/Y)
- Net sales per active customer rose +8.7% to $388 (vs. $357 last year)
- Autoship customer sales were up +34.4%
- Active customers increased +31.6% to 19.8 million
- Gross Margin: 27.6% (vs. 25.7% last year)
Key Takeaways:
- Q2 Guidance: $2.15 to $2.17 billion
- Full Year Revenue Guidance: $8.9 to $9.0 billion
- The company has been experiencing labor shortages and out-of-stock supply issues.
- Though the pet food segment accounts for the lion’s share of the company’s revenues, its non-food segment (e.g., Connect with a Vet, Compounding Pharmacy and Petscriptions) should continue to provide additional growth.

Earnings Calendar of Select Companies
| Announce Date | Company | EPS Estimate | Previous Quarter EPS | |
| 6/17/2021 | The Kroger Co. (KR) | $ 0.99 | $ 0.81 |
Source: Bloomberg, CNBC, Yahoo Finance, Food Institute