This year’s food industry surprises are just as surprising and challenging as last year’s. In 2026, the biggest issue involves sky-high gas prices. Advan has foot traffic and transaction data to try to untangle how that is impacting restaurant visitation and consumer spend. Given that this is earnings season, we also have ample company results and commentary to add color.
Our conclusion: higher gas prices are likely to be a modest drag on visitation to national limited-service restaurants, less so for local establishments and full-service restaurants.
Recall that the last gas spike was June 2022, a time when household savings accounts were bumper (due to fiscal stimulus) and before inflation ripped. This time around, less affluent households are more strapped. Another difference was that in 2022, we were coming out of the pandemic, and there was a lot of pent-up demand for going out and about; nothing was going to stop that – YOLO.
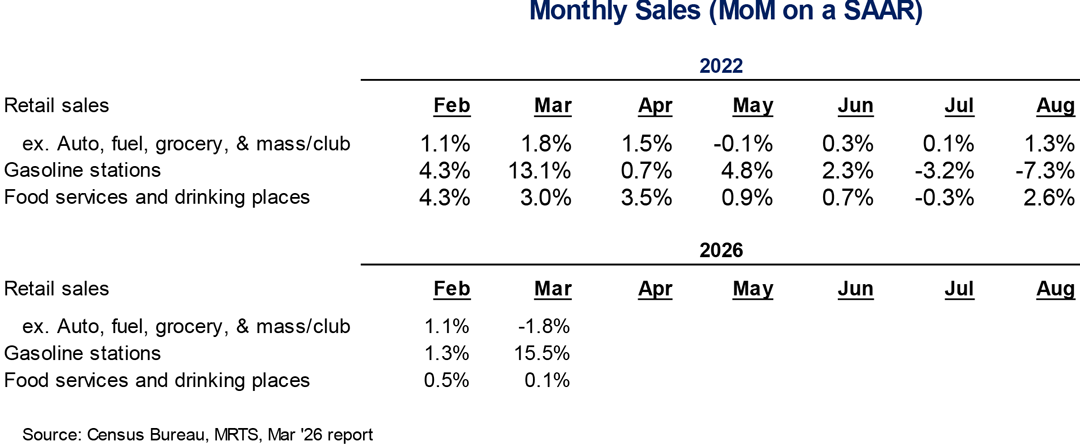
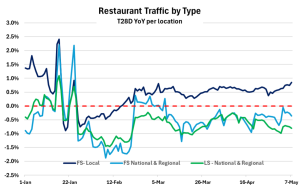
The table below shows that there was little curtailment in demand in March of 2022 in response to the spike in gas prices, but when a second step up in May happened, there was with MoM growth decelerating from +3.5% to +0.9%. For the next two months, demand remained sluggish until gas prices fell in July and August, leading to a better August in restaurant spend. Turning to 2026, there was also some demand destruction with MoM* growth in foodservice decelerating from +0.5% to +0.1% (adverse weather was also a likely contributor). (April PCE has yet to be reported.) Advan’s traffic index (below) shows that limited-service traffic has modestly softened since late March. 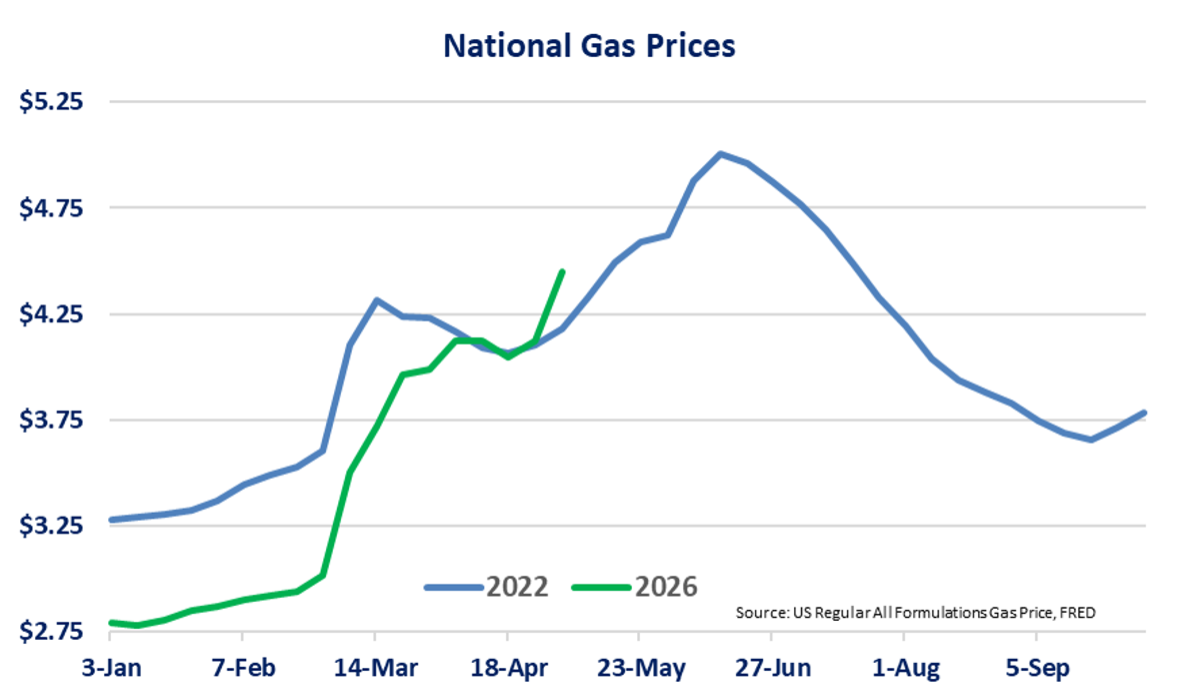
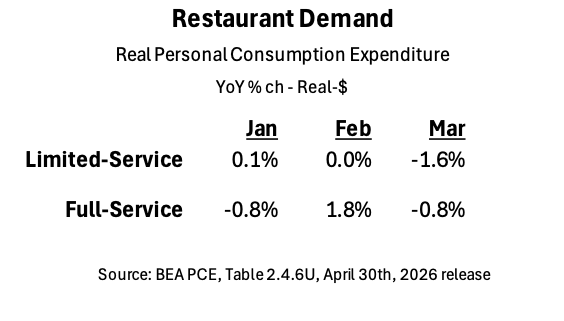
Advan has three restaurant indexes: full-service national/regional brands (539K* establishments), full-service independents (329K), and limited-service national/regional brands (293K). Advan’s traffic data points to a slight slowdown during March for full-service independents (local) and a touch more for full-service and limited-service national brands. During April the trend improved modestly. We suspect that full-service local is more levered to the affluent households and special/only occasional visits, allowing it to better shrug off the gas impact. By contrast, limited-service has a broader customer base, and it is typically a home-meal replacement. As such, when households are facing budgetary pressures, they become more prone to cook at home.
We also suspect that Advan’s full-service local index is comprised with a broader population of local establishments than the BEA’s PCE figure, providing an explanation for why the index was more resilient.
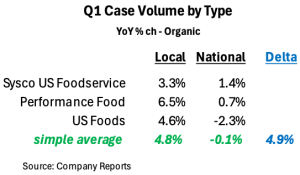
What about the commentary from recent results by the national restaurant chains? See Shake Shack tanking -28% on results. Comments from national brands on the health of the consumer have less weight as they’re losing share as a category to local. National brands that are outperforming, such as Chili’s and Olive Garden, flagged no consumer/macro slowdown with their reported results (our take). From the results of Sysco Foods, Performance Food Group, and US Food Holdings no material impact/slowdown was evident. Their results again showed that national brands are doing worse, as has been evident in the results since the 2H of last year. For Q1, the gap between distributor volumes for Local and National at 490bps was very large versus historic trends (Q4 was 410bps).
Why are locals outperforming national brands? Or hypothesis is nimbler operations, better localization, the consumer trend towards “authenticity and original,” more frequent menu refreshments, and fewer price increases. It’s a question
that we will be seeking answers to at the National Restaurant Association Show in Chicago later this week. After the event, we’d love to compare takeaways and answers to the question. (Send me an e-mail.)
In addition to cooking more at home when higher gas prices bite into consumer wallets, gas & convenience (G&C) can also be a substitute for a limited-service meal. However, using Chevron as our example, visits to the pump pad have been more dynamic than to the store, resulting in a modest drop during March, followed by an improving trend during April. Adverse weather was also a factor in late January, February, and March. (There was a slight rush in demand during March to fill tanks before prices rose, producing an air pocket in early April.) We conclude that the trend has been volatile, but not definitive, i.e. there is no evidence of a trade away from limited-service in favor of G&C during the current period of higher gas prices.
![]()
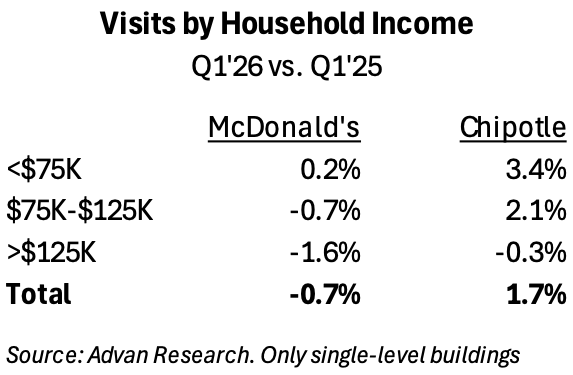
Finally, we looked at YoY changes in the limited-service customer mix, putting Chipotle and McDonald’s under the microscope. (Here’s our takeaways on Q4 and Q1 results.) As shown below***, visitors with household incomes under $75K produced the strongest growth; whereas incomes above $125K declined (which we take to be the impact of GLP-1 weight-loss drug uptake, a frequent topic of ours). Additionally, McDonald’s has a heavy campaign (value and otherwise) to take share (and serve well) in the lower-income cohort. For April, McDonald’s visits slipped a bit more (-1.3%), whereas Chipotle firmed up (+2.4%). We suspect that the slip was due to higher gas prices, with the decline more pronounced in households with incomes in the $50K-$100K range.
Advan will be at the NRS. Let me know if you would like to meet up.
* Here we are using MoM figures because 2022’s are so distorted by the pandemic re-opening.
**Yes, those figures are correct. We measure activity at substantially more establishments than BlackBox, or others.
*** Advan doesn’t observe visits to locations in urban canyons, indoor malls, airports, etc.
About the author: Thomas Paulson has been the Head of Market Insights for Advan Research since January 2025. Previously, he served as Director of Research and Business Development at Placer.ai. His extensive background also includes two decades as an analyst and portfolio manager in asset management at AllianceBernstein, Cornerstone, and others. Currently, Thomas also co-leads the Consumer/Retail Roundtable for the National Association for Business Economics (NABE).
About Advan Research: Advan specializes in providing foot traffic and transaction data in the U.S.. This comes from 40M smartphones, 120M transaction cards, and 158M points of interest (retailer, shopping center, theme park, manufacturing plant, mine operation, dialysis treatments, etc.). The foot traffic is contextualized with demographic/psychographic attached to it. The data is aggregated and anonymized – see it like a Census profile for a particular Census block group. The data goes back to January 2015 and is as recent as yesterday. We sell our data to investment firms and corporates.