Here are trending economic and food industry data points, as well as major economic and company earnings releases for the coming week: food inflation, earnings from Cracker Barrel (CBRL), Sanderson Farms (SAFM), Costco (COST) and more.
Why doesn’t the Fed share the rest of the world’s concerns about food inflation?
The impact of food inflation differs across countries and income levels
The Federal Reserve regards current inflation conditions to be transitory. They see the impact of food inflation as minimal since the weighting of food and beverages on the overall CPI basket is only 10% to 15%. The U.S. CPI is heavily weighted towards housing. The core PCE price index, one of the central bank’s favorite measures of inflation, excludes the more volatile and seasonal food and energy prices. Through this lens, the Fed is correct is in their assessment, but that’s not the story for the rest of the world. In most emerging economies, food and beverage is a much more important part of their consumer baskets (see graphs below).
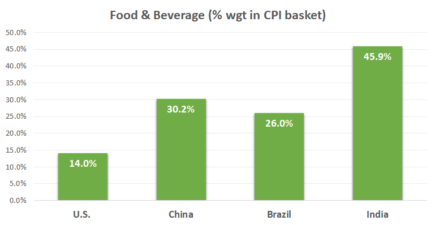

Source: TradingEconomics.com
Changes in relative currency valuation over the past year have made the matter even worse for some countries. For example, Brazil has experienced greater demand for exports because they are cheaper for foreign buyers, and as such, their domestic supply has become strained.
Likewise, food inflation creates a heavier burden for lower income families, widening the wealth gap globally.
Why does the food industry worry about inflation?
As early as Q3/Q4 2020, quite a few food companies expressed concerns about inflation. For example, in Q1 2021, B&G Foods, Inc. (BGS) cited escalating SG&A expenses and input cost inflation as key concerns for the company going forward.
B&G Foods, Inc. (BGS)
Income Statement
| $ mil | Q1-2021 | Q1-2020 | YoY % Chg | |
| Operating Revenue | 505.1 | 449.4 | 12.4% | |
| Cost of Revenue | 387.3 | 344.5 | 12.4% | |
| Selling, General and Administrative | 50.4 | 40 | 26.0% |
Source: Yahoo Finance
In addition to surging commodities prices, pandemic-related restrictions have increased logistical costs over the past year. Even if one assumes that logistical costs will come down as economy recovers, wages are likely to trend higher over time. Many food companies will see double-digit increases to their costs this year – some of which are not transitory.
Large food companies, such as B&G Foods, have been able to pass some cost increases to consumers over the past year, but if cost inflation keeps up, their pricing power may be limited for several reasons. One is that wholesale retail prices for consumer products generally lag the underlying commodities prices. In 2020 and 2021 YTD, corn commodity prices have jumped >20% annually, whereas process sweet corn price remained roughly the same (see table below).
| % Change YoY | ||||||
| 2017 | 2018 | 2019 | 2020 | 2021 | ||
| Consumer Product | Processed Sweet Corn Price ($/ton) | -10.2% | 1.5% | -4.9% | -2.6% | |
| Commodity | Corn Commodity Price ($/bushel) | -0.4% | 6.9% | 3.4% | 24.8% | 28.2% |
Source: MacroTrend.net
Another reason is that price competition would likely keep retail prices in check. Walmart said it had about 30% more discounts in stores in Q1 than during the same period a year ago. Retail giants like Walmart can push prices lower due to their comprehensive mix of products and well-managed supply chain. If other companies cannot keep up, they may face the tough choice of losing market share or sacrificing margin.
Upcoming Economic Releases
| Forecast | Previous | |||
| 6/1/2021 | Markit manufacturing PMI (May) | 61.5 | 60.5 | |
| 6/3/2021 | ADP employment report (May) | 545 K | 742 K | |
| 6/3/2021 | Continuing jobless claims (weekly) | 3.58 mil | 3.64 mil | |
| 6/3/2021 | Markit services PMI (May) | 70.1 | 64.7 | |
| 6/4/2021 | Unemployment rate | 5.9% | 6.1% |
Source: Bloomberg, CNBC, Trading Economics, Food Institute
>> For more information on CPI/PPI and Retail Sales, go to Food Institute Economic Benchmarking.
Select Food & Beverage Industry Data Points
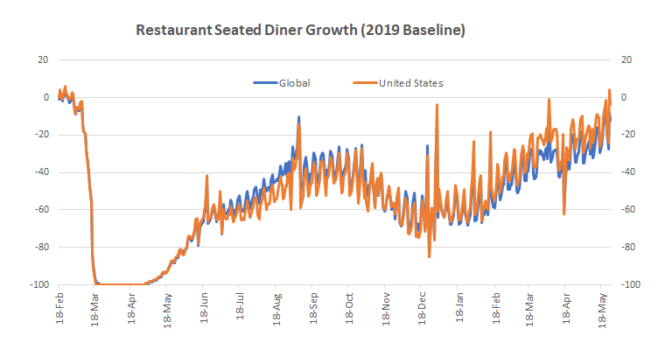
Foodservice – Restaurants
OpenTable restaurant diner growth data (2019 baseline): U.S. = -4% as of May 26, 2021
Cracker Barrel (CBRL) reported Q3 2021 results
- Total Revenues: $713.4 million (+64.9% vs. Q320; -3.5% vs. Q319)
- Comp Store Sales:
- Restaurant: +56.5% vs. Q320 (-8.6% vs. Q319)
- Retail: +102.8% vs. Q320 (+10.8% vs. Q319)
- Comp Store Off-Premise Sales: +144% vs. Q319 (23% of restaurant sales)
- Operating Income: $55.7 million
Key Takeaways:
- Weekly average restaurant sales continue to improve ($56,000 to $70,000)
- Q3 effective occupancy rates were at 75%
- Growth driven by 3 factors: vaccinations / relaxing of dining restrictions, stimulus checks, and investments in off-premise dining
- For Q4, total revenue is expected to remain flat vs. Q419
- In Q4, management expects commodity inflation of 5% with wage inflation rising 3.0% to 3.5%
- Recovery in the foodservice operations has enabled CBRL to reinstate its dividend of $1 / share
Food Manufacturing – Meat Processing
Sanderson Farms (SAFM) reported Q2 2021 results
- Net Sales: $1.134 billion (+34.2%)
- Operating Income: $127.7 million vs. -$43.8 million
- Improved poultry markets more than offset feed grain costs in the quarter
- Improved demand came primarily from the foodservice sector as the industry continued to recover
Key Takeaways:
- Foodservice demand for chicken products is driving company performance
- Overall realized prices for chicken products sold to retail increased +6.2% during the quarter
- Prices from the Company’s food service plants increased significantly:
- Boneless breast meat: +60.4%
- Bulk leg quarters: +12.3%
- Jumbo wings: +88.9%
- Chicken breast tenders: +54.5%
- Overall realized prices for chicken products increased $0.223 per pound, or +32.6%
- Current feed costs remain elevated: $0.35 per pound vs. $0.29 last year (or roughly +20% higher)
Food Retail
Costco (COST) reported Q3 2021 results
- Net Sales: $44.38 billion (+21.7% vs. last year)
- Membership fees increased to $874 million (+11%), with renewal rates at 91% in the U.S. and Canada
- Comp Sales (Adjusted):
- U.S.: +15.2%
- Canada: +16.7%
- Other International: +13.1%
- Total: +15.1%
- E-Comm.: +38.2%
- Gross Margin: 11.18% (35 bps lower)
- Total traffic increased +12.5%
- Average transaction increased to +7.3% worldwide, and +5.7% in the US
- Total # of warehouses: 809; +6 new in the quarter
Key Takeaways:
- COST performance is exceptional, and the comp sales figures attest to its reputation of being “best-in-class”
- Drivers of the business remain consistent:
- Consumer gravitation towards “value”
- E-Commerce strength
- Operationally “best-in-class” in the industry
- Inflation expectations of 2.5% to 3.5%, and management has been prudent in sales price management

Earnings Calendar of Select Companies
| Announce Date | Company | EPS Estimate | Previous Quarter EPS | |
| 6/1/2021 | Campbell Soup Company (CPB) | $ 0.66 | $ 0.84 | |
| 6/3/2021 | The J. M. Smucker Company (SJM) | $ 1.66 | $ 2.45 |
Source: Bloomberg, CNBC, Yahoo Finance, Food Institute